KNITTING THE AIR
A growing collective of knitters are putting their craft to the test by knitting the air data from two Breathe London nodes in Poplar, East London for a year.
The first node is situated outside a primary school, surrounded by residential housing. The second is nearby, on the A12 as it approaches the Blackwall Tunnel. 
There’s a long tradition of knitting data. This knitter created a scarf which tracked train delays on their daily commute and this group has been using knitting to show temperature changes over time. Plus, knitting is essentially coding, before coding existed.
By presenting air quality data in a highly visual and tactile way, Knitting the Air aims to raise awareness of air quality in a more accessible way for local communities.
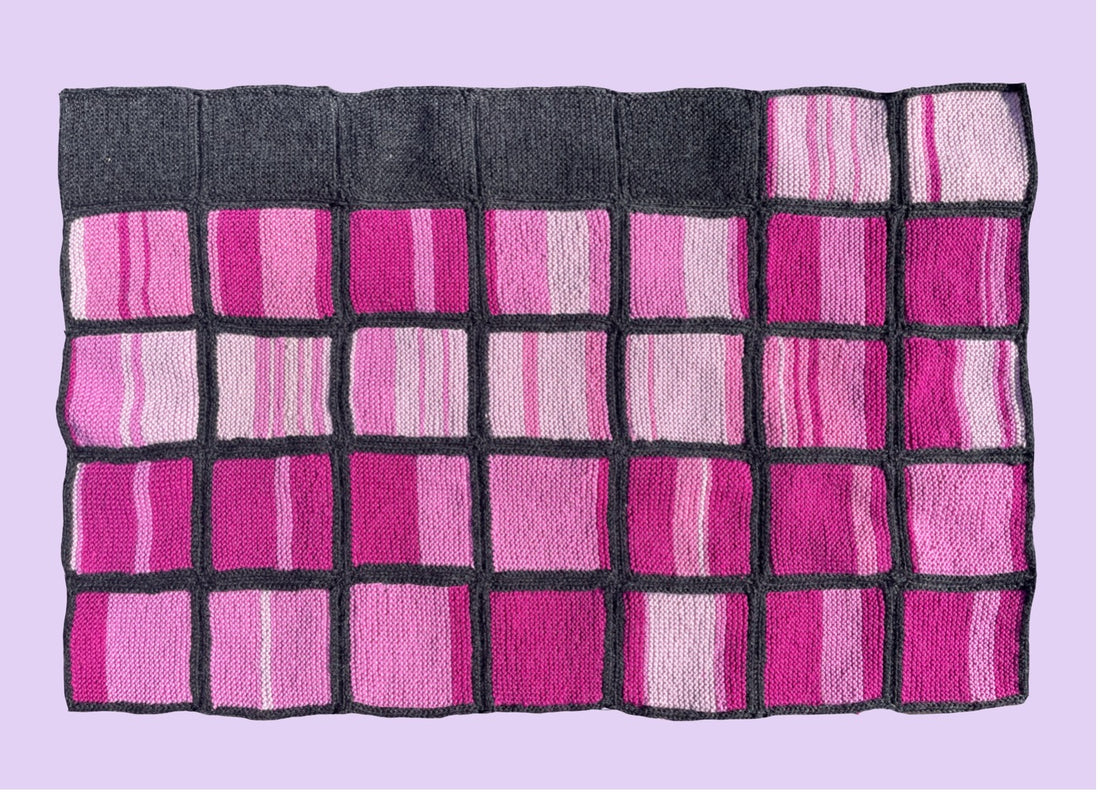
Raw data is downloaded the from the Breathe London website, the readings are colour-coded, the community of knitters are given a knitting pattern, wool and needles and get knitting.

Each square represents 24 hours of air quality data. Once the squares are completed, they’re sewn together, a bit like a monthly calendar, so the squares are viewed sequentially. People can spot patterns and easily compare days and weeks.
The project started in March this year and for data fans, the finished blankets will be made up of nearly 1,500 individual squares. That’s nearly 1.7 million individual knitting stitches! Fortunately, there is a growing group of local knitters lending a hand (and their needles) to make this happen.
As these blankets grow, they are being showcased to the public and communities to open up discussions about air quality. The project is part of Poplar Green Futures.

There is a short work in progress exhibition 29th September to 1st October 9-5pm at Making Space 48 Aberfeldy Street, Poplar E14 0NU with further exhibitions planned.
You can follow their progress and find out about future exhibitions on Instagram @knittingtheair.
Text by Keren McConnell
Images courtesy of Caroline Murray